I'm actually surprised that it worked way better than I expected. Here's a chart of the whole session last night. It actually gives a lot of useful data.
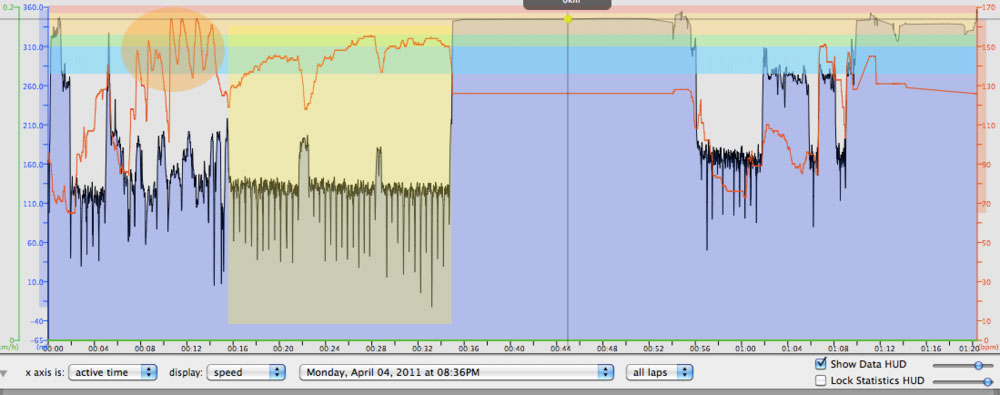
If you're not familiar with this program and what everything in that chart means, the main metric that's tracked here is that red squiggly line, which is heart rate. In the background there are blue, green, yellow and red stripes. Those represent different heart rate training zones. The black squiggly line with the blue fill is actually altitude, which obviously doesn't apply in the pool, but as a side effect it actually pulls in some very useful data too.
I also highlighted a couple points, which are the orange ellipse and the yellow box. The orange was when we did fast 25s testing reaction times, where my heart rate peaked at (a relatively low for being so out of breath) 165 bpm. The yellow highlight is for the first three sets of 300m. It's neat to see my heart rate peak in the second set, and then level off in the third.
The other tool I've been using in the pool has been my Poolmate Pro, which gives me a whole swack more data to cross reference with it. I'm going to have to detail that device in a separate post, but it's been awesome for collecting data.
| time | set # | distance | speed | strokes |
| 0:06:04 | 11 | 300 | 121 | 22 |
| 0:05:44 | 12 | 300 | 114 | 25 |
| 0:05:52 | 12 | 300 | 117 | 24 |
| 0:05:41 | 12 | 300 | 113 | 25 |
| 0:05:40 | 13 | 300 | 113 | 27 |
| 0:05:56 | 13 | 300 | 118 | 26 |
| 0:05:41 | 14 | 300 | 113 | 30 |
So here you can see that I was actually going faster during that second set, which would explain the higher heart rate peak. I'm a little upset that I pulled the Garmin off after the third set, because coach Ayesha got me to increase my stroke rate after the first set, and it took a while to find my groove with it. It looks like the fourth set was much quicker, and I didn't feel that much more tired. It would have been nice to have solid proof.
I ended up removing the GPS, since it felt like it was slipping off whenever I pushed off the wall. I was convinced that I wasn't going to get any useful data anyway.
A side benefit of using a GPS with a barometric altimeter (one of the cycling-focussed Edge models, as opposed to the running-focussed Forerunners) is that you can actually get a lot of detail on how many laps you've done, when you've done them, even down to each individual stroke! I've noticed this while swimming with it in my swim cap as well. When the GPS goes deeper underwater, the pressure increases, and it thinks you're dropping altitude.
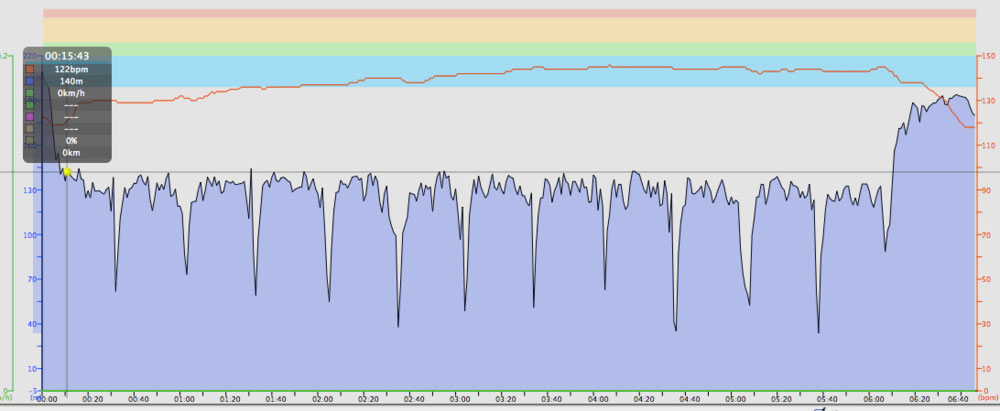
During the first of the 300m sets above, it's very easy to figure out exactly where I did a turn, where I started, where I stopped, and even have a good idea of when I was stroking.
I had a quick look at the raw data that the GPS produced to try and get an idea of how often it was dropping out. The lines on the chart look fairly solid, but when it was slipping down during turns I was a little concerned that it might be missing out. It appears that it was getting my heart rate about 97% of the time. Not perfect, but that's pretty close.
Looking back at the first chart, I tried flipping the orientation of the strap/GPS the other way, and tied the second strap around my neck. I figured that it would at least keep it from sliding down after turns. It did keep it from sliding, but I didn't seem to get any useable data. I think my positioning was a little off, and the top strap was a little tight. I'll try again next time, or maybe I can figure out another way to secure it.
Either way this is really promising, if a little dorky.